Project2 - Video - Anyi Qu
For my project 2
I would like to use energy and daylight simulation in grasshopper for a
planning project in Johnstown, PA. The result will help me with my final study
and landscape architecture design.
Johnstown is a
severely shrinking city in United States, my purpose is to redevelop a site
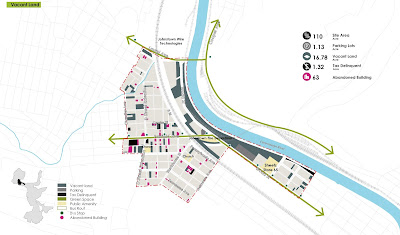
(about 110 acres along the Conemaugh river) and use the existing vacant land
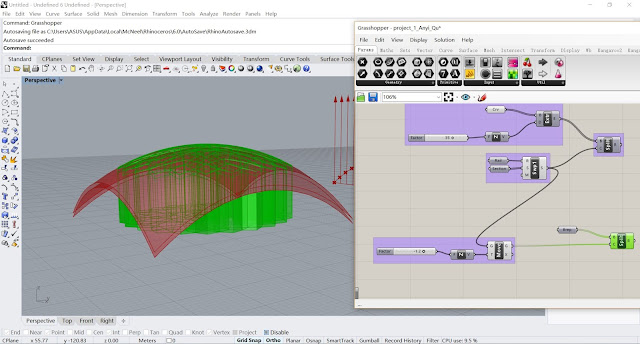
for outdoor activities. I will use three simulation of LADYBUG plugin to
analyze the suitable activities for different vacant lots.
Vacant Map of the site

1. Shadow
Range Analysis
Import weather data from energyplus.net, set the location as Johnstown, Pennsylvania, USA.
Using the date as 21st Dec, as it has the shortest day of the year in north hemisphere, it can help identify shadow areas.
Calculate the sunlight hours, add legend.
2. Map
Annual Comfort on Sunpath
Import the weather data as analysis1, using Outdoor Solar Temperature Adjustor and calculate the comfort level.
To define the comfort level, using range from -3 to +3 to represent extreme cold to extreme heat, color range from deep blue to dark red.
The panel of month can be adjusted to see the weather comfort level in an exact month and time.
The comfort level can help me decide the
suitable days for the outdoor activities and festivals, such as annual Marathon.
3. Monthly
Wind Rose
Import the weather data, set the time range from January to December (12 months in total). Set 12 grids with appropriate spacing for individual maps.
Define the wind speed with 10 levels, using white-yellow-blue color to represent wind speed from low to high.
Generate the wind rose maps and add month and legend.
The wind rose map in each month can tell
whether we need permanent and temporary wind-block facilities in winter, and
how can we bring more summer wind to public space.


